
At our agency, we believe that therapist turnover has both financial and intangible costs.
To understand better how therapist turnover affects us, our management team recently requested an in depth analysis of therapist turnover.
The Direct Cost of IFPS Therapist Turnover
We measured the direct costs of turnover using costs of termination, ad placement, interviewing, training, salary, lost revenue, etc. The cost to replace one IFPS therapist, including costs to the agency and lost revenue, is approximately $43,000. In 2011, 8 IFPS therapists left our agency. This means that in 2011 alone, turnover among these therapists cost us approximately $344,000.
Beyond the Dollars: Intangible Costs of IFPS Therapist Turnover
Although intangible costs cannot be measured in dollars, we believe that they are important to take into account.
- When an experienced therapist leaves and is replaced by someone who has not had experience delivering IFPS, the quality of services offered to families may be impacted.
- High turnover in a team of therapists may also make it difficult to develop binding relationships and may have negative impacts to employee morale or lead to a culture of leaving in an agency.
IFPS Therapist Retention
We were recently asked what percentage of our IFPS therapists from 3 years ago were still employed here. We were disappointed to find that only about 30% of the 31 therapists from April 2010 are still with us today.
On a positive note, our IFPS therapists do tend to stay longer than therapists in our other programs. When we looked at all therapists hired between 2002 and 2008 who have since quit, IFPS therapists stayed an average of 28 months while other therapists only stayed an average of 16 months. This supports current research that suggests that there is less turnover in evidence based practices (Aarons, Sommerfeld, Hecht, Silovsky, and Chaffin, 2009). Unfortunately, evidence based practices also have substantially higher training costs than other programs.
Agency-wide Therapist Turnover
In light of the identified costs of therapist turnover, we have put together some information about the specific turnover rates across all programs at our agency. The following table and pie chart show therapists hired between 2002 and 2008. The six month period category describes the amount of time a therapist stayed before leaving or if they are still currently employed with us. Fifteen percent of our therapists stayed less than six months, 48% left before 18 months, while 25.1% are still currently employed by our agency.
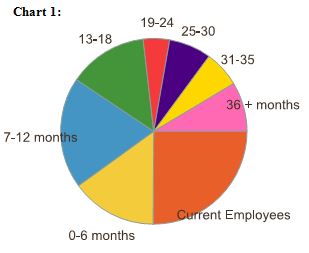
Table 1: Therapists Hired from 2002 through 2008
|
Six Month |
Number |
Percent |
Running Percent |
| 0-6 | 26 | 14.9 | 14.9 |
| 7-12 | 34 | 19.4 | 34.3 |
| 13-18 | 24 | 13.7 | 48 |
| 19-24 | 8 | 4.6 | 52.6 |
| 25-30 | 13 | 7.4 | 60 |
| 31-35 | 11 | 6.3 | 66.3 |
| 36+ | 15 | 8.6 | 74.9 |
| Current Employees | 44 | 25.1 | 100 |
Now what?
We know that turnover among front line workers is costly. We have identified how many people leave, how long they usually stay before leaving, and how much it costs when they leave. Now the question is: how do we keep the good therapists longer?
_______________
 Posted by Don Fryberger
Therapist/Administrative Associate
Institute for Family Development